How to track crop growth change with smartphone?
A smartphone can help to conduct effective monitoring of crops and track crop growth change with nothing special but a camera of a smartphone
By Maryna Kuzmenko
The monitoring of crop growth and performance during developmental stages is an important aspect of agricultural management. It enables the farmer to implement timely interventions that ensure optimal yields at the end of the season. A smartphone can help to conduct effective monitoring of crops and track crop growth change with nothing special but a camera of a smartphone.
Stress factors for crops
Stress in plants refers to external conditions that adversely affect growth, development or productivity of plants. Plant stress can be divided into two primary categories namely abiotic stress and biotic stress.
Abiotic stress
Abiotic stress is imposed on plants by environment. It may be either physical or chemical. Some stresses to the plants injured them as such that plants exhibit several metabolic dysfunctions. The plants can be recovered from injuries if the stress is mild or of short term as the effect is temporary while as severe stresses leads to death of crop plants by preventing flowering, seed formation and induce senescence. Such plants will be considered to be stress susceptible. However several plants like desert plants (Ephemerals) can escape the stress altogether.
Biotic stress
Briefly, biotic stress in different from Abiotic stress. Living organisms cause this type of stress. For example, it may be caused viruses, bacteria, fungi, nematodes, insects, arachnids and weeds.
The agents causing biotic stress directly deprive their host of its nutrients can lead to death of plants. Frequently, biotic stress becomes major because of pre- and postharvest losses. Despite lacking the adaptive immune system plants can counteract biotic stresses by evolving themselves to certain sophisticated strategies.
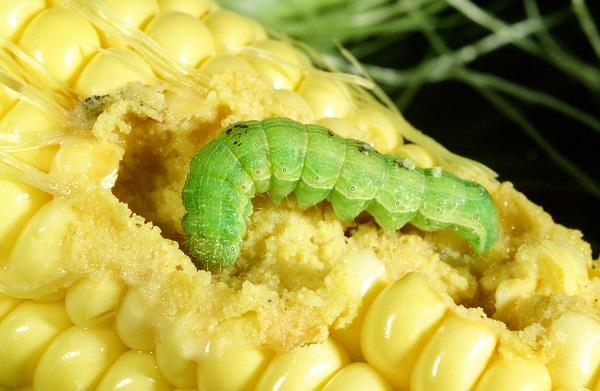
List of main abiotic and biotic stress factors for crops
Stress factors often prevent crops from developing at the rate they are capable of. For example, the most widespread stress factors include:
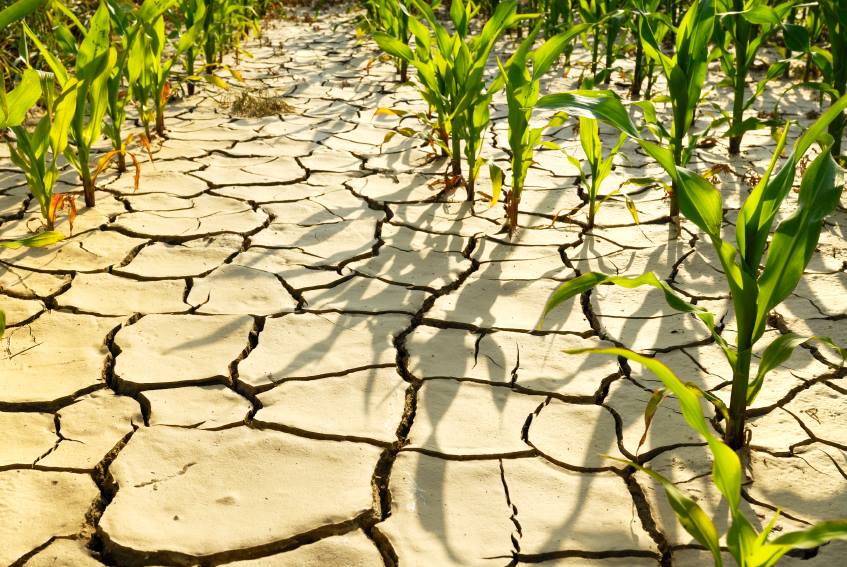
- Poor water availability, in particular, because of the in-season drought.
- Extreme temperatures. In other words, both heat and freeze impact on crops
- Competition among plants for sunlight, nutrients, water or space
- Nutrient deficiency, for example, artificial fertilizer or manure
- Toxicity or other uncontrolled use of chemicals
- Fungal, bacterial or viral infection
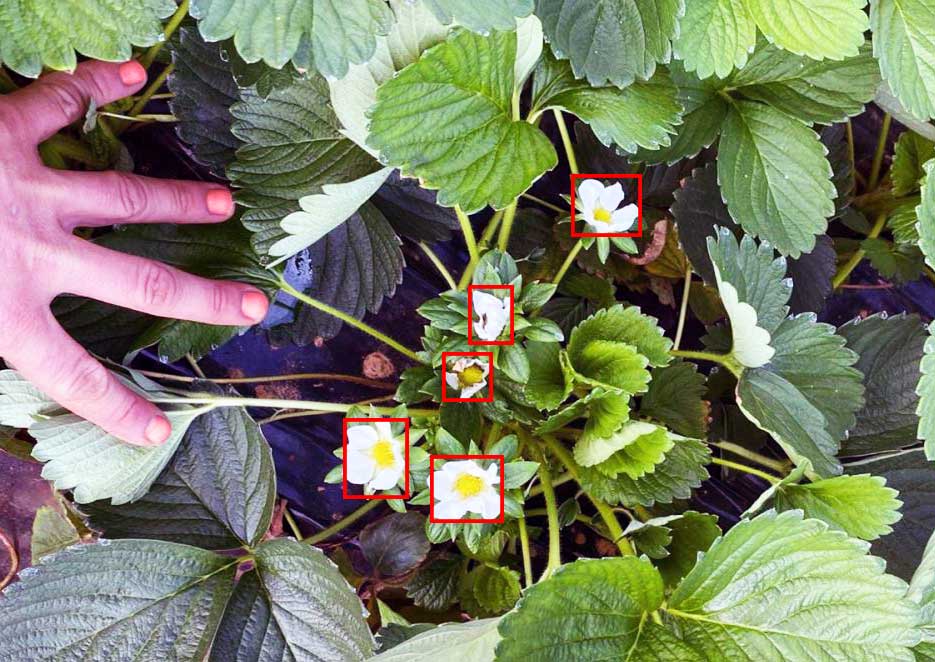
- Attack from insects or other organisms. They may cause stress for crops above or below the ground.
Vegetation indeces
Vegetation indices are the primary tool that helps to understand the health of crops provides near-real-time information about the crop condition.
- Normalized Difference Vegetation Index (NDVI)
- Leaf Area Index (LAI)
- Fraction of green Vegetation Cover (FCover)
Normalized Difference Vegetation Index (NDVI)
Normalized Difference Vegetation Index (NDVI) quantifies vegetation by measuring the difference between near-infrared (which vegetation strongly reflects) and red light (which vegetation absorbs). It always ranges from -1 to +1.
NDVI is calculated from the visible and near-infrared light reflected by vegetation.
In fact, one of the most highly used equipment for building NDVI maps are drones. Drones provide high-resolution image taken of crops, it compares the reflected intensities of near infrared (NIR) and visible light. Autonomous aircrafts are improved and cost effective instruments for data acquisition, real-time thermal imagery to the ground control station and fastest medium for quick time and critical analysis of the crop.
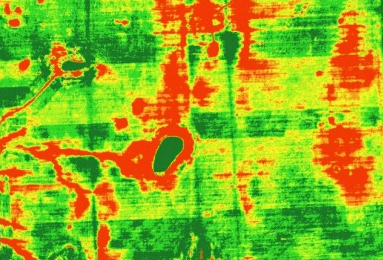
Recent Research Papers on Normalized Difference Vegetation Index (NDVI)
- Sozzi, M.; Kayad, A.; Gobbo, S.; Cogato, A.; Sartori, L.; Marinello, F. Economic Comparison of Satellite, Plane and UAV-Acquired NDVI Images for Site-Specific Nitrogen Application: Observations from Italy. Agronomy 2021, 11, 2098. https://doi.org/10.3390/agronomy11112098
- Sun L., Gao F., Xie D., Anderson M., Chen R., Yang Y., Yang Y., Chen Z., Reconstructing daily 30 m NDVI over complex agricultural landscapes using a crop reference curve approach, Remote Sensing of Environment, Volume 253, 2021, 112156, https://doi.org/10.1016/j.rse.2020.112156
- Roy B., Optimum machine learning algorithm selection for forecasting vegetation indices: MODIS NDVI & EVI, Remote Sensing Applications: Society and Environment, Volume 23, 2021, 100582, https://doi.org/10.1016/j.rsase.2021.100582.
Leaf Area Index (LAI)
The definition of Leaf area index (LAI) is the following: LAI is a total one-sided green leaf area per unit of ground surface. In other words, LAI is a parameter, which growers use to measure the amount of foliage in canopies. Hence, it is based on the measurement of coverage of leaves per unit of the ground surface. Alternatively, it is possible to say that, LAI measures how many layers of leaves are in a m2 of surface.
This variable also represents the amount of leaf material in ecosystems and controls the links between biosphere
and atmosphere through various processes such as photosynthesis, respiration, transpiration and rain interception.
LAI of plant canopies plays an important role in controlling the interactions between terrestrial environments and atmospheric variables. Also it helps to track crop growth change.
There are two main approaches to measuring the leaf area index, in particular, directly or indirectly.
Direct methods to measure LAI
Direct methods require a physical collection of leaves. For some crops this is not a difficult task. It is possible to set traps on the ground to collect the falling leaves. After collecting the leaves, it will be possible to measure the LAI using a digital leaf area meter (or handheld equipment) or an image scanner.
The use of direct methods in non-deciduous plants is destructive, as you need to harvest leaves. When it comes to crops, however, growers use direct methods post-harvest.
Indirect methods to measure LAI
Indirect methods to estimate LAI use hemispherical photography, also known as canopy or fisheye photography. This is a photograph taken upwards, from below the canopy. You can then determine the LAI using different methods to analyze the photograph. There is a variety of equipment that does so automatically.
Indirect measurements of leaf area index are prone to inaccuracies and tend to slightly underestimate the true LAI.
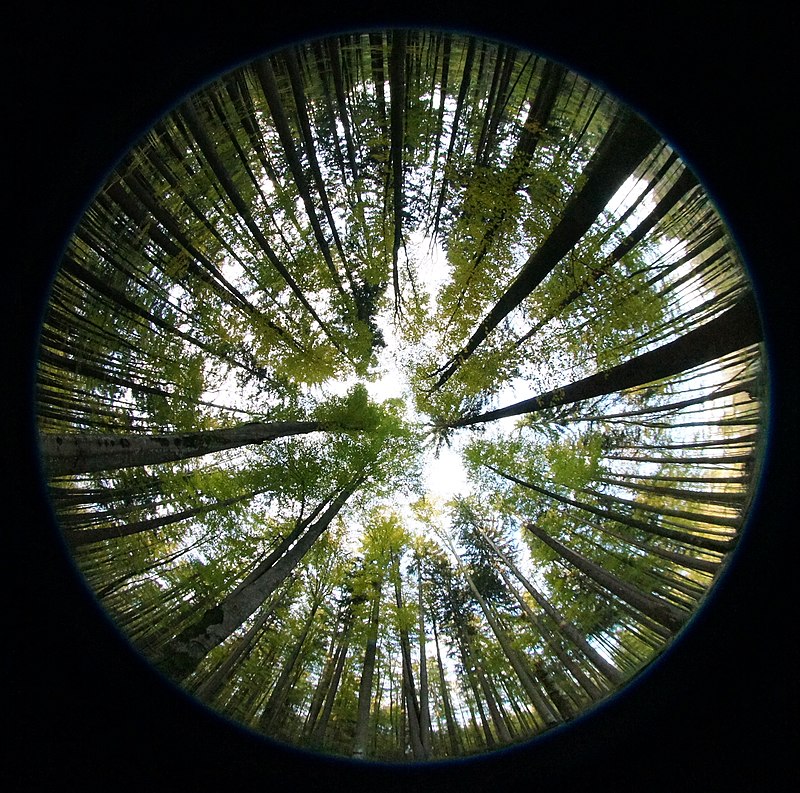
Recent Research Papers on Leaf Area Index (LAI)
- Fang H., Li S., Zhang Y., Wei S., Wang Y., New insights of global vegetation structural properties through an analysis of canopy clumping index, fractional vegetation cover, and leaf area index, Science of Remote Sensing, Volume 4, 2021, 100027, https://doi.org/10.1016/j.srs.2021.100027
- Kaplan, G.; Fine, L.; Lukyanov, V.; Manivasagam, V.S.; Malachy, N.; Tanny, J.; Rozenstein, O. Estimating Processing Tomato Water Consumption, Leaf Area Index, and Height Using Sentinel-2 and VENµS Imagery. Remote Sensing. 2021, 13, 1046. https://doi.org/10.3390/rs13061046
- Liu F., Wang C., Wang X., Sampling protocols of specific leaf area for improving accuracy of the estimation of forest leaf area index, Agricultural and Forest Meteorology, Volumes 298–299, 2021, 108286, https://doi.org/10.1016/j.agrformet.2020.108286
- Gaso D., Wit A., Berger A., Kooistra L., Predicting within-field soybean yield variability by coupling Sentinel-2 leaf area index with a crop growth model, Agricultural and Forest Meteorology, Volumes 308–309, 2021, 108553, https://doi.org/10.1016/j.agrformet.2021.108553
- Li Y., Liu H., Ma J., Zhang L., Estimation of leaf area index for winter wheat at early stages based on convolutional neural networks, Computers and Electronics in Agriculture, Volume 190, 2021, 106480, https://doi.org/10.1016/j.compag.2021.106480
Fraction of Green Vegetation Cover (FCover or FVC)
The Fraction of Vegetation Cover (FCover; Fractional Vegetation Cover; FVC) corresponds to the fraction of ground covered by green vegetation. Importantly, monitoring fCover on agricultural fields from the early season onwards presents an indication of the rate of crop development. Increasing fCover is a sign of development of leaf area or above-ground biomass.
There is experimentally proven relationships between fractional vegetation cover, NDVI and LAI (Carlson et al. 1997, ). In most cases, however, this relationship is highly non-linear.
FCover also provides a measure of the susceptibility of the soils in a farm field to erosion. This means that crops with high fractional vegetation cover at early developmental stages intercept incident radiation and rainfall better, thereby increasing soil shading and decreasing soil evaporation. This data can also help with estimation of irrigation requirements.
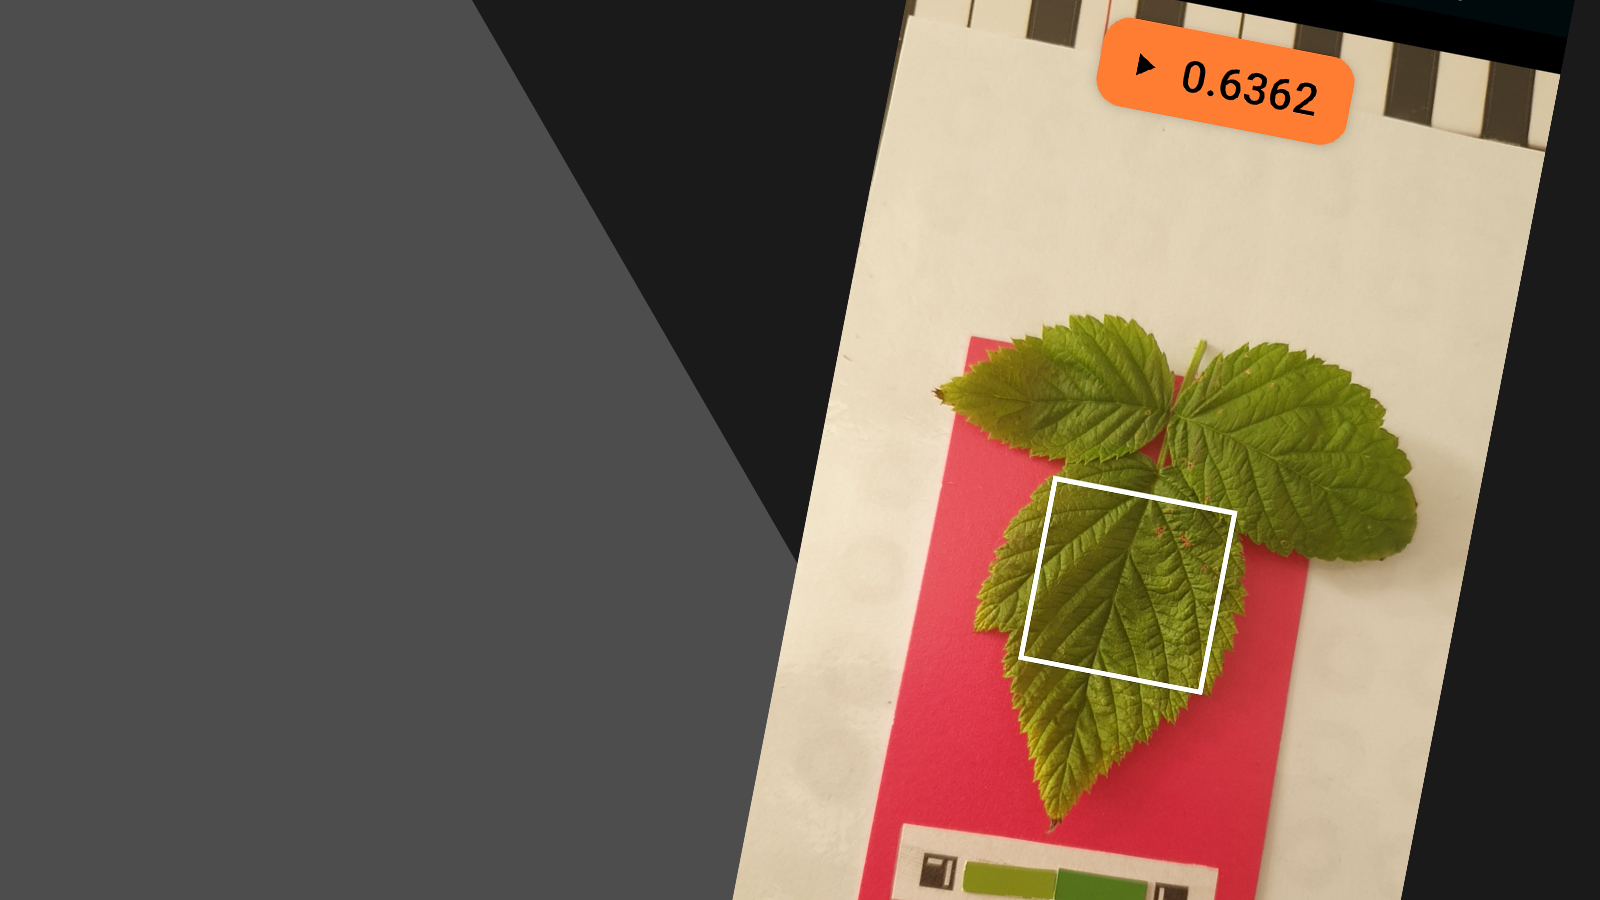
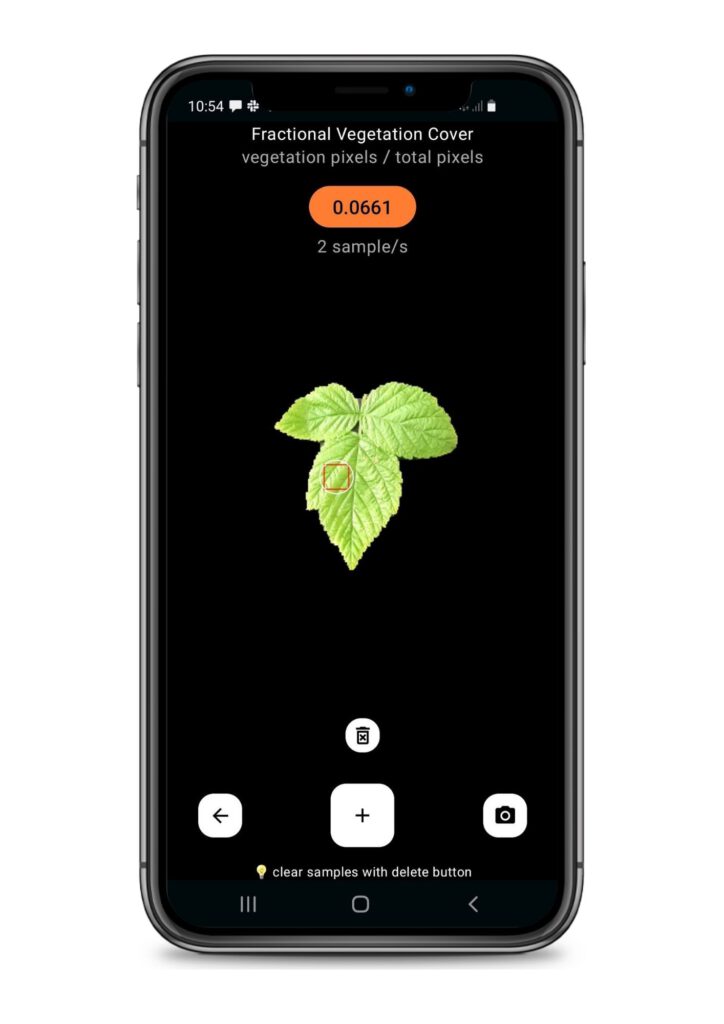
It is possible to estimate fractional vegetation cover from digital images. For this purposes, a photo of crops must be taken in a field from a vertical position looking downwards. The device used can be a digital camera or smartphone. The picture is interpreted into “crop/plant area” and “soil area” from which FVC is estimated.
Recent Research Papers on Fractional green Vegetation Cover (FCover)
- Joseph K. Mhango, W. Edwin Harris, James M. Monaghan. (2021) Relationships between the Spatio-Temporal Variation in Reflectance Data from the Sentinel-2 Satellite and Potato (Solanum Tuberosum L.) Yield and Stem Density. Remote Sensing 13:21, pages 4371. https://doi.org/10.1080/22797254.2020.1839359
- Kamenova I., Dimitrov P. (2021) Evaluation of Sentinel-2 vegetation indices for prediction of LAI, fAPAR and fCover of winter wheat in Bulgaria, European Journal of Remote Sensing, 54:sup1, 89 108. https://doi.org/10.1080/22797254.2020.1839359
- Gao L., Wang X., Johnson B., Tian Q., Wang Y., Verrelst J., Mu X., Gu X. Remote sensing algorithms for estimation of fractional vegetation cover using pure vegetation index values: A review, ISPRS Journal of Photogrammetry and Remote Sensing, Volume 159, 2020, Pages 364-377, https://doi.org/10.1016/j.isprsjprs.2019.11.018.
- Zhengdong D., Zhao L., Guangyuan W., Daqing W., Zhibin D., Hongfei Z., Haoli X., Yue S., Zijian C., Xiaoning Z. Extraction of fractional vegetation cover in arid desert area based on Chinese GF-6 satellite, Open Geosciences, vol. 13, no. 1, 2021, pp. 416-430. https://doi.org/10.1515/geo-2020-0241
- Kaitao L. Comparison of Two Different Calculation Methods of Fractional Vegetation Cover, ICGEC 2021, E3S Web of Conferences 290, 03009 (2021), https://doi.org/10.1051/e3sconf/202129003009
Instruction how to track crop growth change with Fractional Vegetation Cover at Petiole Pro
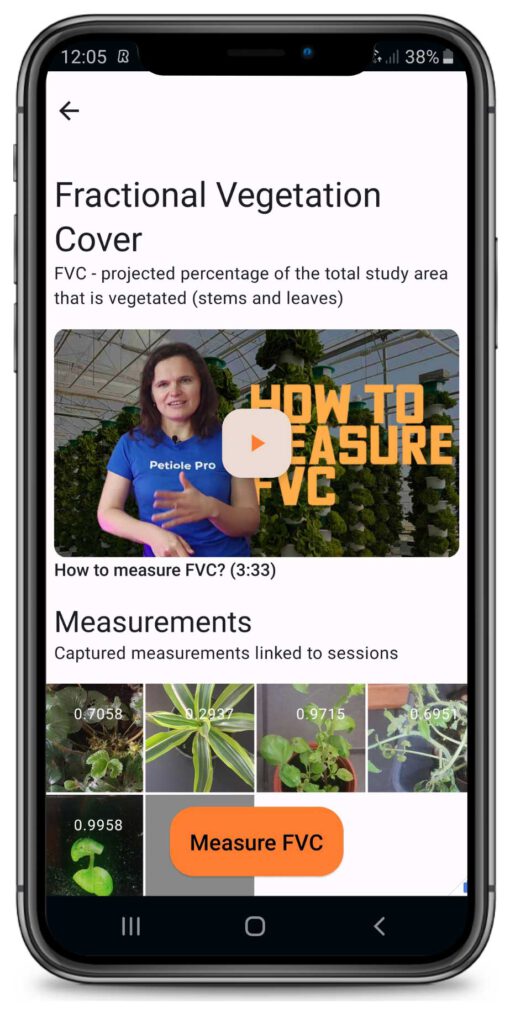
- Firstly, download Petiole Pro and launch it on your device.
- Then open the module [Fractional Vegetation Cover].
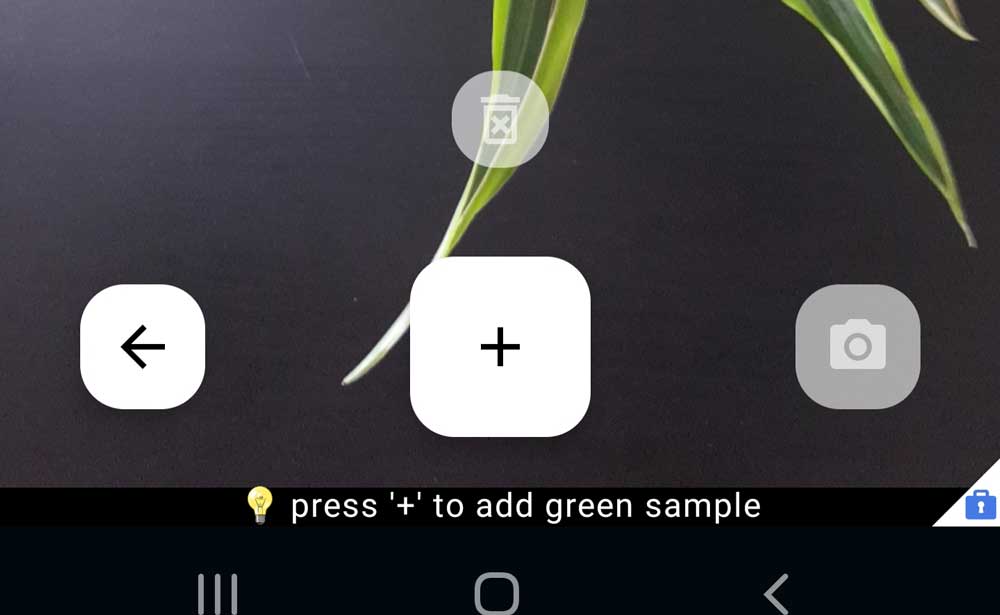
- Place a smartphone in looking downwards above the crop and press plus [+].
- After that, tap on any black pixels on your plant or press [+] to add green sample. Follow this step and add as many samples as you need until you will see on a display screen the green plant without black pixels on it.
- Place the smartphone on eye level and make a photo by pressing a button on the right-hand side of the [+]. This button has a sign of a camera. It will save the photo of your crop and current FVC measurement. Alternatively you can use a tripod, mobile holder or any other stand to keep the same height each time you measure Fractional Vegetation Cover.
- Finally, find your measurements in the Gallery of FVC module.
- Measure FVC as frequently as you need, following previous steps.
- As a result you will be able to compare the numbers and photos of your crops to track crop growth change.